
来源:Deephub Imba 本文约15000字,建议阅读15分钟本文将通过视觉方式解释用于分类和回归问题的决策树的理论基础。

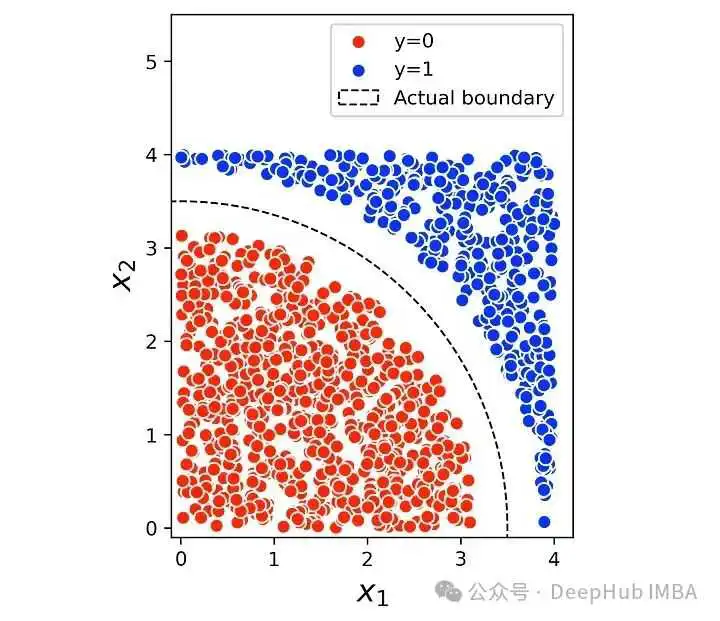
import pandas as pdimport numpy as npimport matplotlib.pyplot as pltfrom sklearn.tree import DecisionTreeClassifierfrom sklearn.tree import DecisionTreeRegressorfrom sklearn import treefrom matplotlib.colors import ListedColormapnp.random.seed(7)low_r = 10high_r = 15n = 1550X = np.random.uniform(low=[0, 0], high=[4, 4], size=(n,2))drop = (X[:, 0]2 + X[:, 1]2 > low_r) & (X[:, 0]2 + X[:, 1]2 < high_r)X = X[~drop]y = (X[:, 0]2 + X[:, 1]2 >= high_r).astype(int)colors = ['red', 'blue']plt.figure(figsize=(6, 6))for i in np.unique(y):plt.scatter(X[y==i, 0], X[y==i, 1], label = "y="+str(i),color=colors[i], edgecolor="white", s=50)circle = plt.Circle((0, 0), 3.5, color='black', fill=False,linestyle="--", label="Actual boundary")plt.xlim([-0.1, 4.2])plt.ylim([-0.1, 5])ax = plt.gca()ax.set_aspect('equal')ax.add_patch(circle)plt.xlabel('$x_1$', fontsize=16)plt.ylabel('$x_2$', fontsize=16)plt.legend(loc='best', fontsize=11)plt.show()
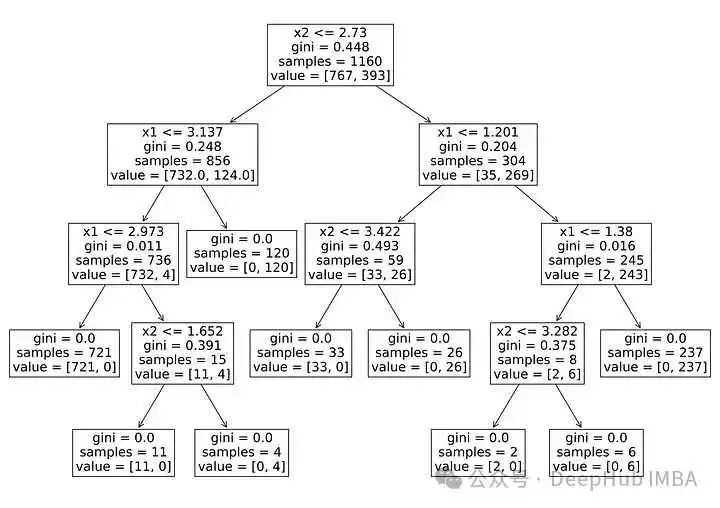
tree_clf = DecisionTreeClassifier(random_state=0)tree_clf.fit(X, y)plt.figure(figsize=(17,12))tree.plot_tree(tree_clf, fontsize=17, feature_names=["x1", "x2"])plt.show()


def plot_boundary_lines(tree_model):def helper(node, x1_min, x1_max, x2_min, x2_max):if feature[node] == 0:plt.plot([threshold[node], threshold[node]],[x2_min, x2_max], color="black")if feature[node] == 1:plt.plot([x1_min, x1_max], [threshold[node],threshold[node]], color="black")if children_left[node] != children_right[node]:if feature[node] == 0:helper(children_left[node], x1_min,threshold[node], x2_min, x2_max)helper(children_right[node], threshold[node],x1_max, x2_min, x2_max)else:helper(children_left[node], x1_min, x1_max,x2_min, threshold[node])helper(children_right[node], x1_min, x1_max,threshold[node], x2_max)feature = tree_model.tree_.featurethreshold = tree_model.tree_.thresholdchildren_left = tree_model.tree_.children_leftchildren_right = tree_model.tree_.children_rightx1_min = x2_min = -1x1_max = x2_max = 5helper(0, x1_min, x1_max, x2_min, x2_max)
def plot_boundary(X, y, clf, lims):gx1, gx2 = np.meshgrid(np.arange(lims[0], lims[1],(lims[1]-lims[0])/300.0),np.arange(lims[2], lims[3],(lims[3]-lims[2])/300.0))cmap_light = ListedColormap(['lightsalmon', 'aqua'])gx1l = gx1.flatten()gx2l = gx2.flatten()gx = np.vstack((gx1l,gx2l)).Tgyhat = clf.predict(gx)gyhat = gyhat.reshape(gx1.shape)plt.pcolormesh(gx1, gx2, gyhat, cmap=cmap_light)plt.scatter(X[y==0, 0], X[y==0,1], label="y=0", alpha=0.7,color="red", edgecolor="white", s=50)plt.scatter(X[y==1, 0], X[y==1,1], label="y=1", alpha=0.7,color="blue", edgecolor="white", s=50)plt.legend(loc='upper left')
plt.figure(figsize=(6,6))plot_boundary(X, y, tree_clf, lims=[-1, 5, -1, 5])plot_boundary_lines(tree_clf)ax = plt.gca()ax.set_aspect('equal')plt.xlim([-1, 5])plt.ylim([-1, 5])plt.xlabel('$x_1$', fontsize=16)plt.ylabel('$x_2$', fontsize=16)plt.show()

plt.figure(figsize=(6,6))plot_boundary(X, y, tree_clf, lims=[-1, 5, -1, 5])circle = plt.Circle((0, 0), 3.5, color='black', fill=False,linestyle="--", label="Actual boundary")plt.text(3.5, 4.5, r"$\hat{y}=1$", fontsize=13)plt.text(2.35, 2.1, r"$\hat{y}=0$", fontsize=13)ax = plt.gca()ax.set_aspect('equal')ax.add_patch(circle)plt.xlabel('$x_1$', fontsize=16)plt.ylabel('$x_2$', fontsize=16)plt.xlim([-0.1, 4.2])plt.ylim([-0.1, 5])plt.legend(loc='upper left')plt.show()


np.random.seed(1)n = 550X1 = np.random.uniform(low=[0, 0], high=[4, 4], size=(n,2))drop = (X1[:, 0] > 1.8) & (X1[:, 0] < 1.9)X1 = X1[~drop]y1 = (X1[:, 0] > 1.9).astype(int)X2 = np.random.uniform(low=[1.7, 0], high=[1.9, 4], size=(15,2))y2 = np.ones(15).astype(int)X = np.concatenate((X1, X2), axis=0)y = np.concatenate((y1, y2))colors = ['red', 'blue']for i in np.unique(y):plt.scatter(X[y==i, 0], X[y==i, 1], label = "y="+str(i),color=colors[i], edgecolor="white", s=50)plt.axvline(x=1.8, color="black", linestyle="--")plt.legend(loc='best')plt.xlim([-0.5, 4.5])plt.ylim([-0.2, 5])ax = plt.gca()ax.set_aspect('equal')plt.xlabel('$x_1$', fontsize=16)plt.ylabel('$x_2$', fontsize=16)plt.show()

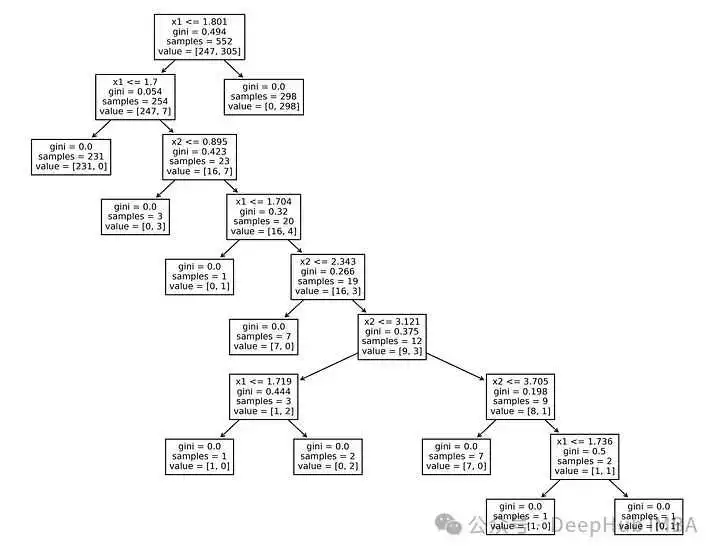
#Listing 8tree_clf = DecisionTreeClassifier(random_state=1)tree_clf.fit(X, y)plt.figure(figsize=(13,10))tree.plot_tree(tree_clf, fontsize=9, feature_names=["x1", "x2"])plt.show()
#Listing 9plt.figure(figsize=(6,6))plot_boundary(X, y, tree_clf, lims=[-1, 5, -1, 5])plt.axvline(x=1.8, color="black", linestyle="--", label="Actual boundary")plt.text(0, -0.3, r"$\hat{y}=0$", fontsize=13)plt.text(3, -0.3, r"$\hat{y}=1$", fontsize=13)ax = plt.gca()ax.set_aspect('equal')plt.xlim([-0.5, 4.5])plt.ylim([-0.5, 4.5])plt.xlabel('$x_1$', fontsize=16)plt.ylabel('$x_2$', fontsize=16)plt.legend(loc="best")plt.show()

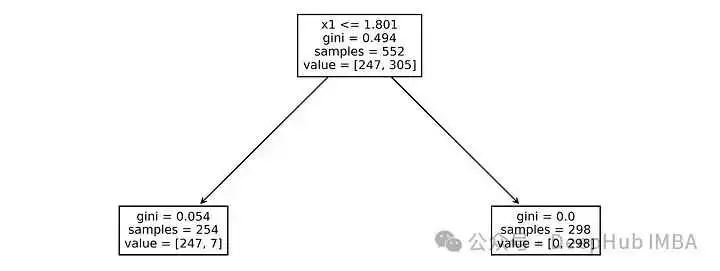
tree_clf1 = DecisionTreeClassifier(random_state=1, max_depth=1)tree_clf1.fit(X, y)plt.figure(figsize=(10,5))tree.plot_tree(tree_clf1, fontsize=9, feature_names=["x1", "x2"])plt.show()
#Listing 11plt.figure(figsize=(6,6))plot_boundary(X, y, tree_clf1, lims=[-1, 5, -1, 5])plt.axvline(x=1.8, color="black", linestyle="--", label="Actual boundary")plt.text(0, -0.3, r"$\hat{y}=0$", fontsize=13)plt.text(3, -0.3, r"$\hat{y}=1$", fontsize=13)ax = plt.gca()ax.set_aspect('equal')plt.xlim([-0.5, 4.5])plt.ylim([-0.5, 4.5])plt.xlabel('$x_1$', fontsize=16)plt.ylabel('$x_2$', fontsize=16)plt.legend(loc="best")plt.show()


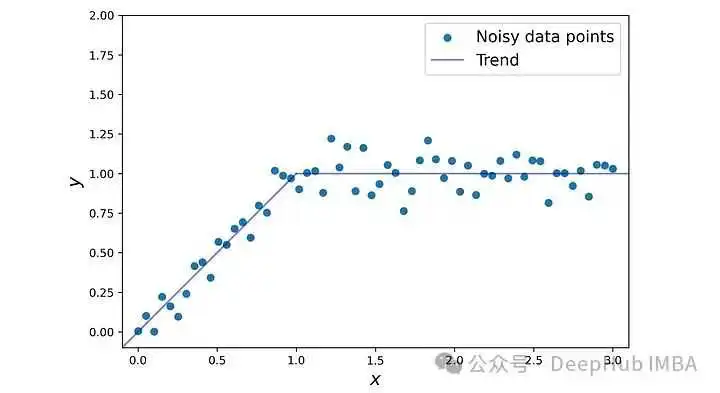
np.random.seed(4)x = np.linspace(0, 3, 60)x1 = np.linspace(0, 1, 20)x2 = np.linspace(1, 3, 40)y = x.copy()y[x>=1] = 1y = y + np.random.normal(scale=0.1, size=60)X = x.reshape(-1, 1)plt.figure(figsize=(8,8))plt.scatter(x, y, label="Noisy data points")plt.plot(x1, x1, color="blue", alpha=0.5, label="Trend")plt.plot(x2, len(x2)*[1], color="blue", alpha=0.5)plt.xlim([-0.1, 3.1])plt.ylim([-0.1, 2])plt.xlabel('$x$', fontsize=16)plt.ylabel('$y$', fontsize=16)ax = plt.gca()ax.set_aspect('equal')plt.legend(loc="best", fontsize=14)plt.show()
tree_regres = DecisionTreeRegressor(random_state=0, max_depth=3)tree_regres.fit(X, y)plt.figure(figsize=(17,8))tree.plot_tree(tree_regres, fontsize=10, feature_names=["x"])plt.show()
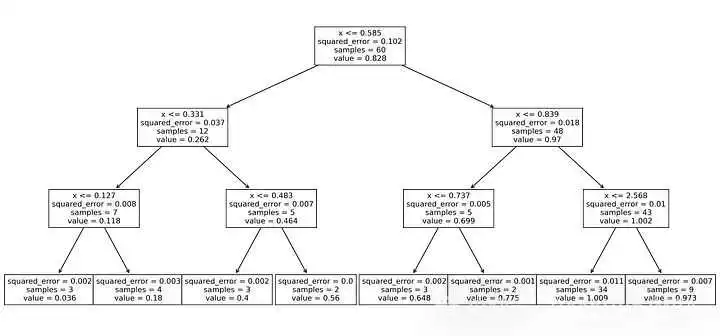
y.mean() #0.828
((y.mean()-y)2).mean() #0.102

y[(X <=0.585).flatten()].mean() #0.262
((0.262 - y[(X <= 0.585).flatten()])2).mean() #0.037

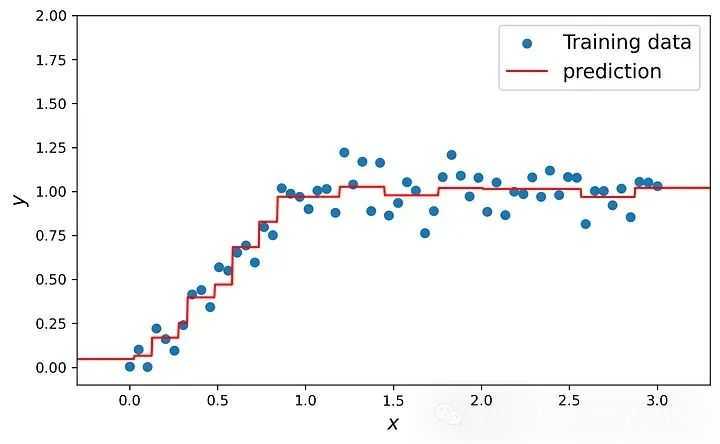
x1 = np.linspace(0, 1, 20)x2 = np.linspace(1, 3, 40)X_space = np.linspace(-0.3, 3.3, 1000).reshape(-1, 1)yhat = tree_regres.predict(X_space)plt.figure(figsize=(8,6))plt.scatter(x, y, label="Training data")plt.plot(X_space, yhat, color="red", label="prediction")plt.plot(x1, x1, color="blue", alpha=0.5, label="Trend")plt.plot(x2, len(x2)*[1], color="blue", alpha=0.5)plt.legend(loc="best", fontsize=14)plt.xlim([-0.3, 3.3])plt.ylim([-0.1, 2])ax = plt.gca()ax.set_aspect('equal')plt.xlabel('$x$', fontsize=14)plt.ylabel('$y$', fontsize=14)plt.show()

X_space = np.linspace(-0.3, 3.3, 1000).reshape(-1, 1)tree_regres = DecisionTreeRegressor(random_state=1)tree_regres.fit(X, y)yhat = tree_regres.predict(X_space)plt.figure(figsize=(8,6))plt.scatter(X, y, label="Training data")plt.plot(X_space, yhat, color="red", label="prediction")plt.xlim([-0.3, 3.3])plt.ylim([-0.1, 2])plt.legend(loc="best", fontsize=14)plt.xlabel('$x$', fontsize=14)plt.ylabel('$y$', fontsize=14)ax = plt.gca()ax.set_aspect('equal')plt.show()

tree_regres.tree_.max_depth #11
tree_regres.get_n_leaves() #60
tree_regres.score(X,y) #1.0


class GradBoostingRegressor():def __init__(self, num_estimators, learning_rate, max_depth=1):self.num_estimators = num_estimatorsself.learning_rate = learning_rateself.max_depth = max_depthself.tree_list = []def fit(self, X, y):self.F0 = y.mean()Fm = self.F0for i in range(self.num_estimators):tree_reg = DecisionTreeRegressor(max_depth=self.max_depth,random_state=0)tree_reg.fit(X, y - Fm)Fm += self.learning_rate * tree_reg.predict(X)self.tree_list.append(tree_reg)def predict(self, X):y_hat = self.F0 + self.learning_rate * \np.sum([t.predict(X) for t in self.tree_list], axis=0)return y_hat
M = 9X_space = np.linspace(-0.3, 3.3, 1000).reshape(-1, 1)gbm_reg = GradBoostingRegressor(num_estimators=M+1, learning_rate=0.3)gbm_reg.fit(X, y)fig, axs = plt.subplots(M+1, 2, figsize=(11, 45))plt.subplots_adjust(hspace=0.3)axs[0, 0].axis('off')axs[0, 1].scatter(X, y, label="y")axs[0, 1].axhline(y=gbm_reg.F0, color="red", label="$F_0(x)$")axs[0, 1].set_title("m=0", fontsize=14)axs[0, 1].set_xlim([-0.3, 3.3])axs[0, 1].set_ylim([-0.5, 2])axs[0, 1].legend(loc="best", fontsize=12)axs[0, 1].set_aspect('equal')axs[0, 1].set_xlabel("x", fontsize=13)axs[0, 1].set_ylabel("y", fontsize=13)for i in range(1, M+1):Fi_minus_1 = gbm_reg.F0 + gbm_reg.learning_rate * \np.sum([t.predict(X) for t in gbm_reg.tree_list[:i-1]],axis=0)axs[i, 0].scatter(X, y-Fi_minus_1, label=f"$y-F_{{{i-1}}}(x)$")axs[i, 0].plot(X_space, gbm_reg.tree_list[i-1].predict(X_space),color="red",label=f"$h_{{{i}}}(x)$")axs[i, 0].set_title("m={}".format(i), fontsize=14)axs[i, 0].set_xlim([-0.3, 3.3])axs[i, 0].set_ylim([-1, 2])axs[i, 0].set_xlabel("x", fontsize=13)axs[i, 0].set_ylabel("residual", fontsize=13)axs[i, 0].legend(loc="best", fontsize=12)axs[i, 0].set_aspect('equal')axs[i, 1].scatter(X, y, label="y")Fi = gbm_reg.F0 + gbm_reg.learning_rate * \np.sum([t.predict(X_space) for t in gbm_reg.tree_list[:i]],axis=0)axs[i, 1].plot(X_space, Fi, color="red", label=f"$F_{{{i}}}(x)$")axs[i, 1].set_title("m={}".format(i), fontsize=14)axs[i, 1].set_xlim([-0.3, 3.3])axs[i, 1].set_ylim([-0.5, 2])axs[i, 1].set_xlabel("x", fontsize=13)axs[i, 1].set_ylabel("y", fontsize=13)axs[i, 1].legend(loc="best", fontsize=13)axs[i, 1].set_aspect('equal')plt.show()

X_space = np.linspace(-0.3, 3.3, 1000).reshape(-1, 1)gbm_reg = GradBoostingRegressor(num_estimators=50, learning_rate=0.3)gbm_reg.fit(X, y)y_hat = gbm_reg.predict(X_space)plt.figure(figsize=(8,6))plt.scatter(x, y, label="Training data")plt.plot(X_space, y_hat, color="red", label="prediction")plt.xlim([-0.3, 3.3])plt.ylim([-0.1, 2])plt.legend(loc="best", fontsize=14)plt.xlabel('$x$', fontsize=14)plt.ylabel('$y$', fontsize=14)ax = plt.gca()ax.set_aspect('equal')plt.show()
from sklearn.ensemble import GradientBoostingRegressorgbm_reg_sklrean = GradientBoostingRegressor(n_estimators=50,learning_rate=0.3,max_depth=1)gbm_reg_sklrean.fit(X, y)y_hat_sklrean = gbm_reg_sklrean.predict(X_space)np.allclose(y_hat, y_hat_sklrean)


class GradBoostingClassifier():def __init__(self, num_estimators, learning_rate, max_depth=1):self.num_estimators = num_estimatorsself.learning_rate = learning_rateself.max_depth = max_depthself.tree_list = []def fit(self, X, y):probability = y.mean()log_of_odds = np.log(probability / (1 - probability))self.F0 = log_of_oddsFm = np.array([log_of_odds]*len(y))probs = np.array([probability]*len(y))for i in range(self.num_estimators):residuals = y - probstree_reg = DecisionTreeRegressor(max_depth=self.max_depth)tree_reg.fit(X, residuals)h = probs * (1 - probs)leaf_nodes = np.nonzero(tree_reg.tree_ .children_left == -1)[0]leaf_node_for_each_sample = tree_reg.apply(X)for leaf in leaf_nodes:leaf_samples = np.where(leaf_node_for_each_sample == leaf)[0]residuals_in_leaf = residuals.take(leaf_samples, axis=0)h_in_leaf = h.take(leaf_samples, axis=0)value = np.sum(residuals_in_leaf) / np.sum(h_in_leaf)tree_reg.tree_.value[leaf, 0, 0] = valueself.tree_list.append(tree_reg)reg_pred = tree_reg.predict(X)Fm += self.learning_rate * reg_predprobs = np.exp(Fm) / (1+ np.exp(Fm))def predict_proba(self, X):FM = self.F0 + self.learning_rate * \np.sum([t.predict(X) for t in self.tree_list], axis=0)prob = np.exp(FM) / (1+ np.exp(FM))return probdef predict(self, X):yhat = (self.predict_proba(X) >= 0.5).astype(int)return yhat
gbm_clf = GradBoostingClassifier(num_estimators=30,learning_rate=0.1, max_depth=1)gbm_clf.fit(X, y)
plt.figure(figsize=(8, 8))plot_boundary(X, y, gbm_clf, lims=[-1, 5, -1, 5])plt.axvline(x=1.8, color="black", linestyle="--", label="Actual boundary")plt.text(0, -0.3, r"$\hat{y}=0$", fontsize=15)plt.text(3, -0.3, r"$\hat{y}=1$", fontsize=15)ax = plt.gca()ax.set_aspect('equal')plt.xlim([-0.5, 4.5])plt.ylim([-0.5, 4.6])plt.xlabel('$x_1$', fontsize=18)plt.ylabel('$x_2$', fontsize=18)plt.legend(loc="best", fontsize=14)plt.show()

from sklearn.ensemble import GradientBoostingClassifiergbm_clf_sklrean = GradientBoostingClassifier(n_estimators=30,learning_rate=0.1,max_depth=1)y)phat_sklrean = gbm_clf_sklrean.predict_proba(X)[:,1]phat = gbm_clf.predict_proba(X)phat_sklrean)
关于我们
数据派THU作为数据科学类公众号,背靠清华大学大数据研究中心,分享前沿数据科学与大数据技术创新研究动态、持续传播数据科学知识,努力建设数据人才聚集平台、打造中国大数据最强集团军。

新浪微博:@数据派THU
微信视频号:数据派THU
今日头条:数据派THU
版权声明:
本文来自互联网用户投稿,该文观点仅代表作者本人,不代表本站立场。本站仅提供信息存储空间服务,不拥有所有权,不承担相关法律责任。
如若内容造成侵权、违法违规、事实不符,请将相关资料发送至xkadmin@xkablog.com进行投诉反馈,一经查实,立即处理!
转载请注明出处,原文链接:https://www.xkablog.com/jszy-jnts/60376.html
