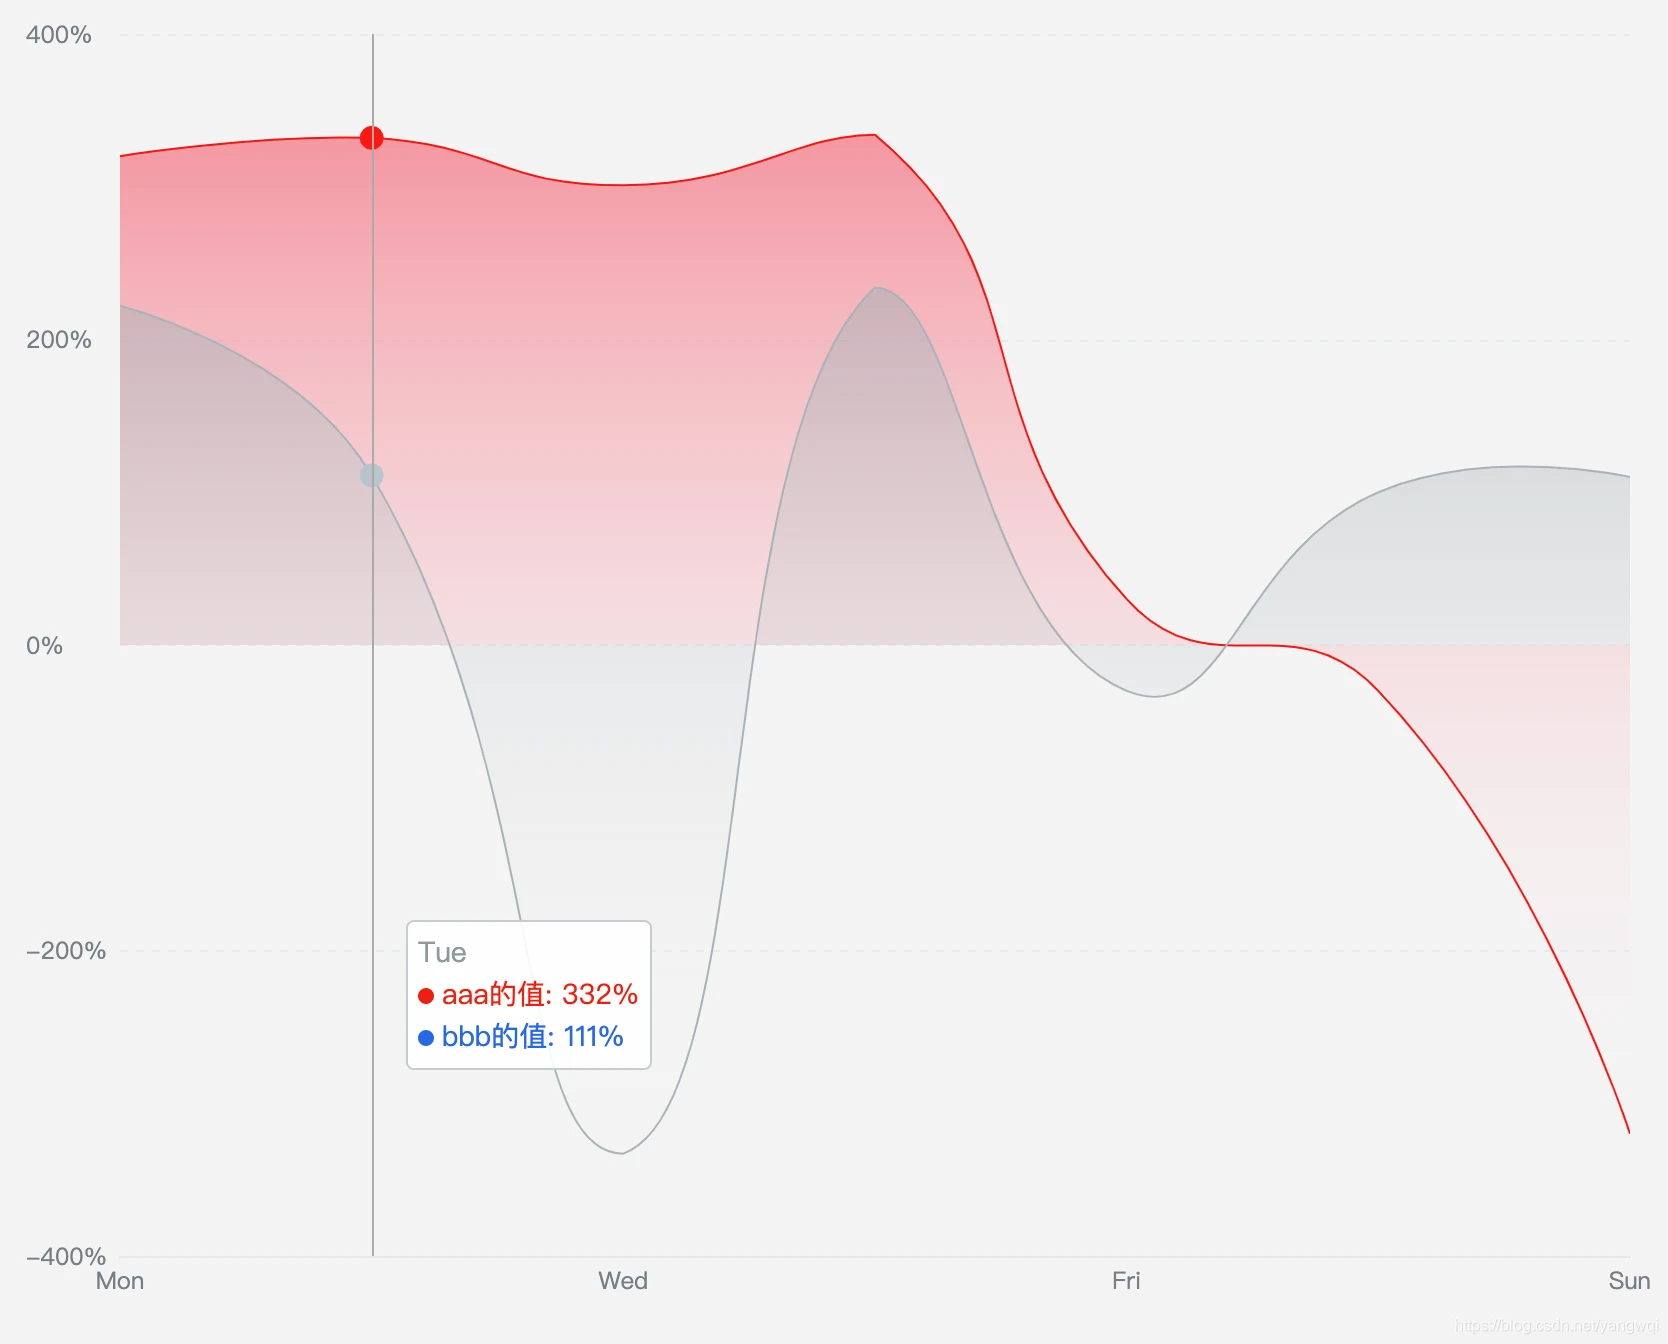
实现一 :自定义坐标轴 提示信息
option = { // 当前列提示信息拼接 :params.value[1]:当前点的y坐标值 tooltip: { // 触发类型:坐标轴触发 show: true, trigger: "axis", backgroundColor: '#FDF5F6', borderColor: '#FDF5F6', position: [0, -40], padding: 0, margin: 0, textStyle: { color: "#F21612" }, hideDelay: 0, showDelay: 0, alwaysShowContent: false, transitionDuration: 0, axisPointer: { show: false, type: 'line', axis: 'x', snap: true, showContent: true, label: { backgroundColor: '#FDF5F6', borderColor: '#FDF5F6', borderWidth: 1, shadowBlur: 0, shadowOffsetX: 0, shadowOffsetY: 0, textStyle: { color: '#fff' }, formatter: function(params, b) { return params.value; } }, lineStyle: { color: '#a9b2bb', width: 1, type: 'solid' }, }, triggerOn: 'click|mousemove', // extraCssText: 'width:100%;height:50px;background:#FDF5F6;', // trigger: 'axis', // backgroundColor: 'rgba(255,255,255,0.9)', // 通过设置rgba调节背景颜色与透明度 // borderColor: '#C5CCD1', // textStyle: { // color: '#8E989E' // }, // hideDelay: '10', formatter: '{b0}<div style="position: relative; padding-left: 12px; color:#EB1F10;"><i style="display:block; width:8px;height:8px;border-radius:10px;background:#EB1F10; position:absolute; top: 7px; left:0;"></i>{a0}: {c0}%</div><div style="position: relative; padding-left: 12px; color:#2B67E8;"><i style="display:block; width:8px;height:8px;border-radius:10px;background:#2B67E8; position:absolute; top: 7px; left:0;"></i>{a1}: {c1}%</div>', color: '#8E989E', borderWidth: '1', // formatter: function (params) { // params = params[0]; // var date = new Date(params.name); // return date.getDate() + '/' + (date.getMonth() + 1) + '/' + date.getFullYear() + ' : ' + params.value[1]; // }, // axisPointer: { // animation: false // }, // extraCssText:'background:rgba(0, 0, 0, 0.5);' }, grid: { left:57,//margin-left right:10, top:24, bottom:33 }, animation: false,//静态绘制echarts xAxis: { type: 'category', z: 8, boundaryGap: false,//边界间隙 data: ['Mon', 'Tue', 'Wed', 'Thu', 'Fri', 'Sat', 'Sun'], //x轴样式修改 axisLine: { show: true, //是否显示坐标轴轴线。 onZero: false,//设置坐标轴(x、y)不从0开始 lineStyle: { color: "#e5e8ef"//坐标轴颜色 } }, // x轴字体样式修改 axisLabel: { show: true, interval: 1,//每间隔1个一展示【中间空一个位置】展示信息 margin: 3, textStyle: { color: '#757E85', //x轴字体颜色 fontSize: 12 }, padding:[3,0,0,0], fontFamily: 'DIN-Regular' }, axisTick: { show: false }, }, yAxis: { type: 'value', scale: false, min: -400,//最大值 max: 400,//最小值 type: 'value', interval:200,//每间隔200个一展示【中间空200个位置】展示y轴信息 splitNumber:7,//y轴均分 z: 8, axisLabel: { inside: true, align: 'left', padding: [0, 0, 0, -55], verticalAlign: 'middle', fontFamily: 'DIN-Regular', formatter: function (params) { return params+'%'; }, rich: { a: { verticalAlign: 'bottom', padding: [5, 0, 0, 0], lineHeight: 10, fontSize: 10, z: 16 } }, textStyle: { color: '#757E85', fontSize: 12 } }, //控制横向网格线属性 splitLine: { lineStyle: { color: '#E5E9EF', type: 'dashed', width: 1 } }, axisLine: { show: false, onZero: false },// 不显示坐标轴轴线 axisTick: { show: false },//不显示坐标轴刻度 alwaysShowContent: false }, series: [{ name: "aaa的值", type: 'line', smooth: true, //是否平滑显示 symbol: 'circle',//每个小点点的样式风格 showSymbol: false,//默认不展示小点点 经过再显示 showAllSymbol: false, z: 10, symbolSize: 5, data: [320, 332, 301, 334, 30, -30, -320], silent: false, itemStyle: { normal: { color: '#F21612',//轨迹线和小点点的颜色 borderColor: '#F21612',//小点点的边框颜色 } }, lineStyle: { normal: { width: 1, //连线粗细 color: "#F21612", //轨迹线颜色 } }, // 阴影区域 areaStyle: { // 渐变颜色 color: new echarts.graphic.LinearGradient(0, 0, 0, 1, [{ offset: 0, color: 'rgba(243, 78, 98, 0.8)' }, { offset: 1, color: 'rgba(255, 255, 255, 0)' }]), // 常规设置 // normal: { // opacity: 1,//阴影面积 0无 1全 // color: "#ddd", // origin: "start" // }, } },{ name: "bbb的值", type: 'line', smooth: true, //是否平滑显示 symbol: 'circle',//每个小点点的样式风格 showSymbol: false,//默认不展示小点点 经过再显示 showAllSymbol: false, z: 10, symbolSize: 5, data: [222, 111, -333, 234, -30, 100, 110], silent: false, itemStyle: { normal: { color: '#A9B2B8',//轨迹线和小点点的颜色 borderColor: '#A9B2B8',//小点点的边框颜色 } }, lineStyle: { normal: { width: 1, //连线粗细 color: "#A9B2B8", //轨迹线颜色 } }, // 阴影区域 areaStyle: { // 渐变颜色 color: new echarts.graphic.LinearGradient(0, 0, 0, 1, [{ offset: 0, color: 'rgba(169,178,184, 0.8)' }, { offset: 1, color: 'rgba(255, 255, 255, 0)' }]), // 常规设置 // normal: { // opacity: 0,//阴影面积 0无 1全 // color: "#ddd", // origin: "start" // }, } }] }
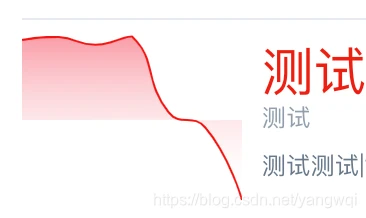
实现二:无坐标轴 提示信息等
option = { grid: { left:0, right:10, top:0, bottom:0 }, xAxis: { type: 'category', boundaryGap: false, data: ['Mon', 'Tue', 'Wed', 'Thu', 'Fri', 'Sat', 'Sun'], axisLine: { show: false, }, axisLabel: { show: false, }, axisTick: { show: false }, }, yAxis: { type: 'value', scale: false, axisLabel: { show: false, }, splitLine: { show: false, }, axisLine: { show: false, onZero: false }, axisTick: { show: false }, alwaysShowContent: false }, series: [{ name: "aaa的值", type: 'line', smooth: true, //是否平滑显示 symbol: 'circle',//每个小点点的样式风格 showSymbol: false,//默认不展示小点点 经过再显示 showAllSymbol: false, z: 10, symbolSize: 5, data: [320, 332, 301, 334, 30, -30, -320], silent: false, itemStyle: { normal: { color: '#F21612',//轨迹线和小点点的颜色 borderColor: '#F21612',//小点点的边框颜色 } }, lineStyle: { normal: { width: 1, //连线粗细 color: "#F21612", //轨迹线颜色 } }, // 阴影区域 areaStyle: { // 渐变颜色 color: new echarts.graphic.LinearGradient(0, 0, 0, 1, [{ offset: 0, color: 'rgba(243, 78, 98, 0.8)' }, { offset: 1, color: 'rgba(255, 255, 255, 0)' }]), } }] }
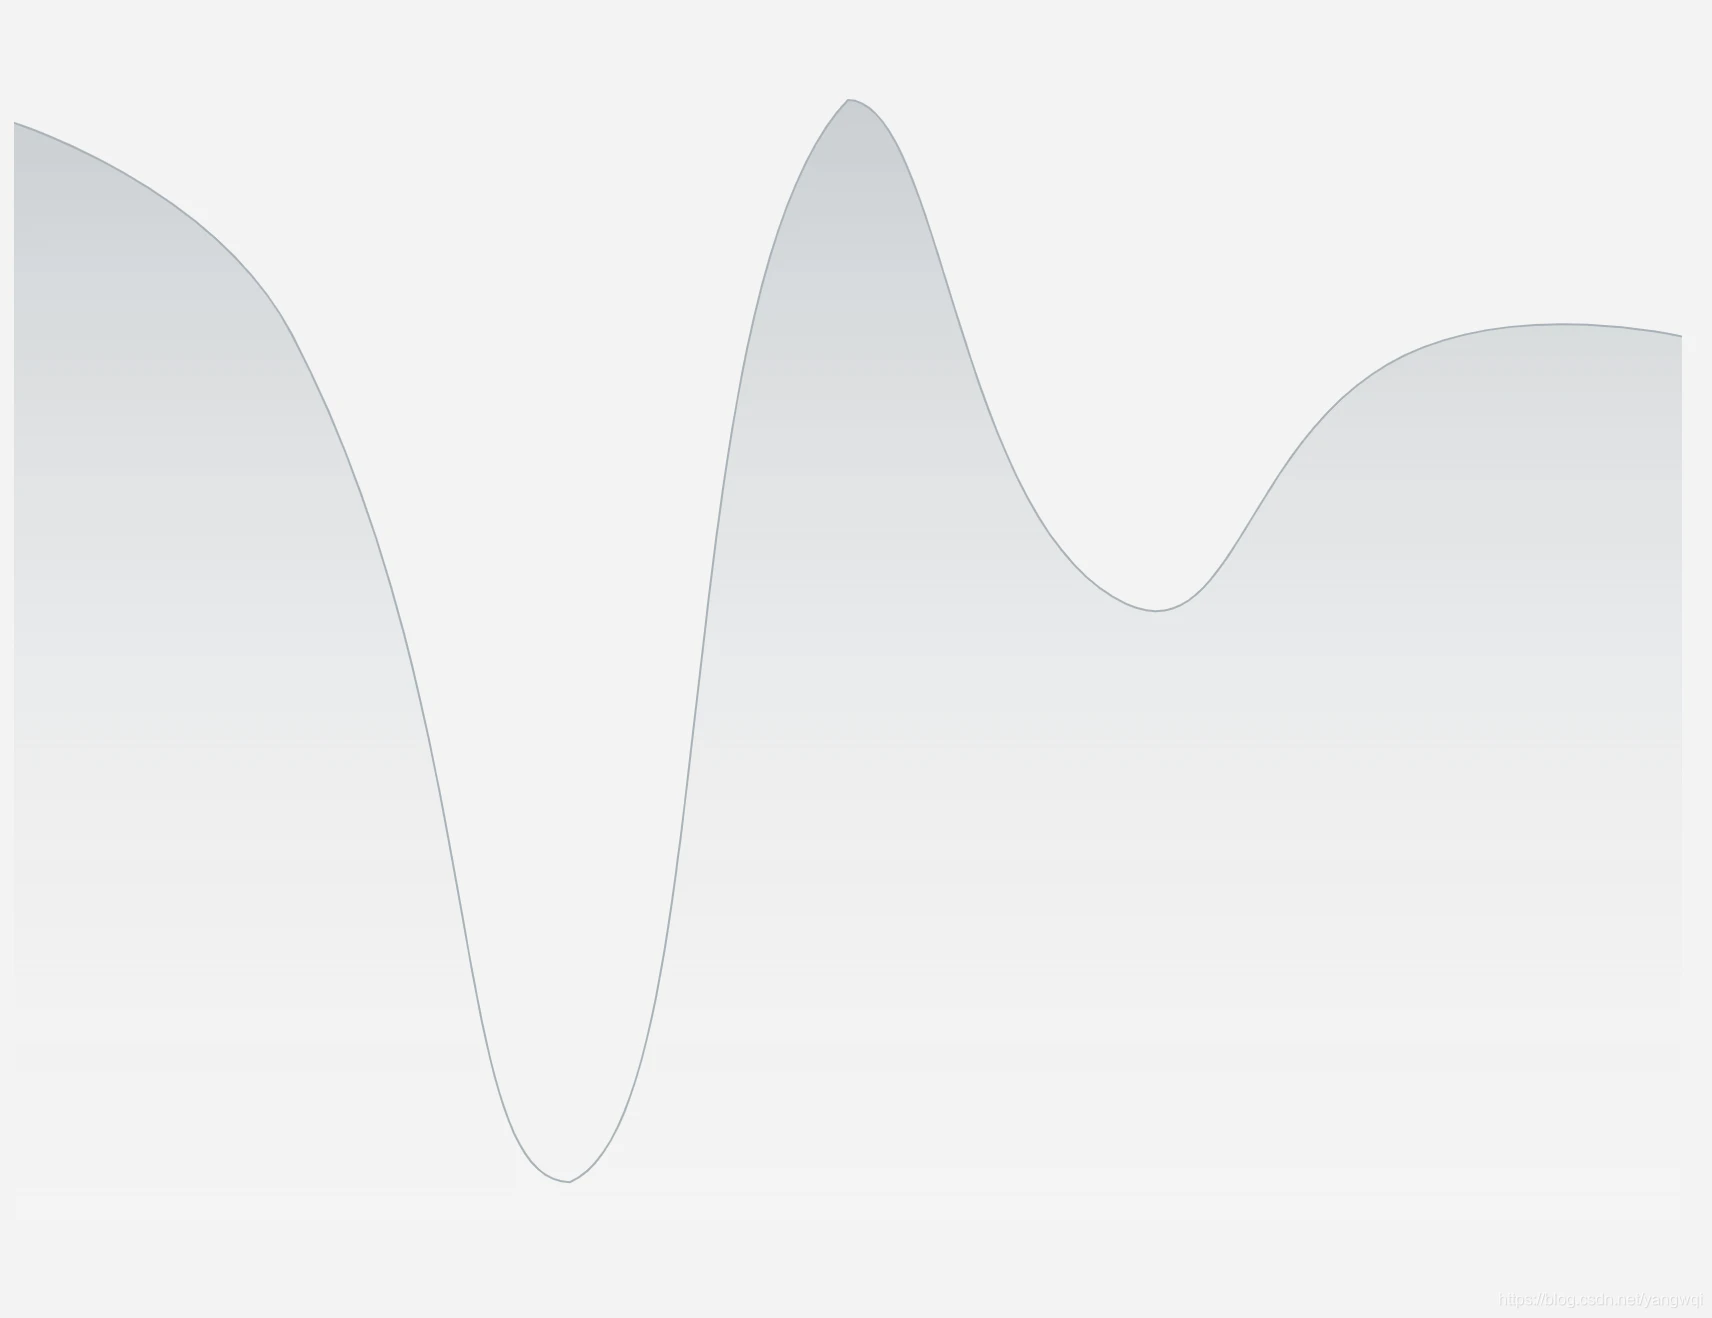
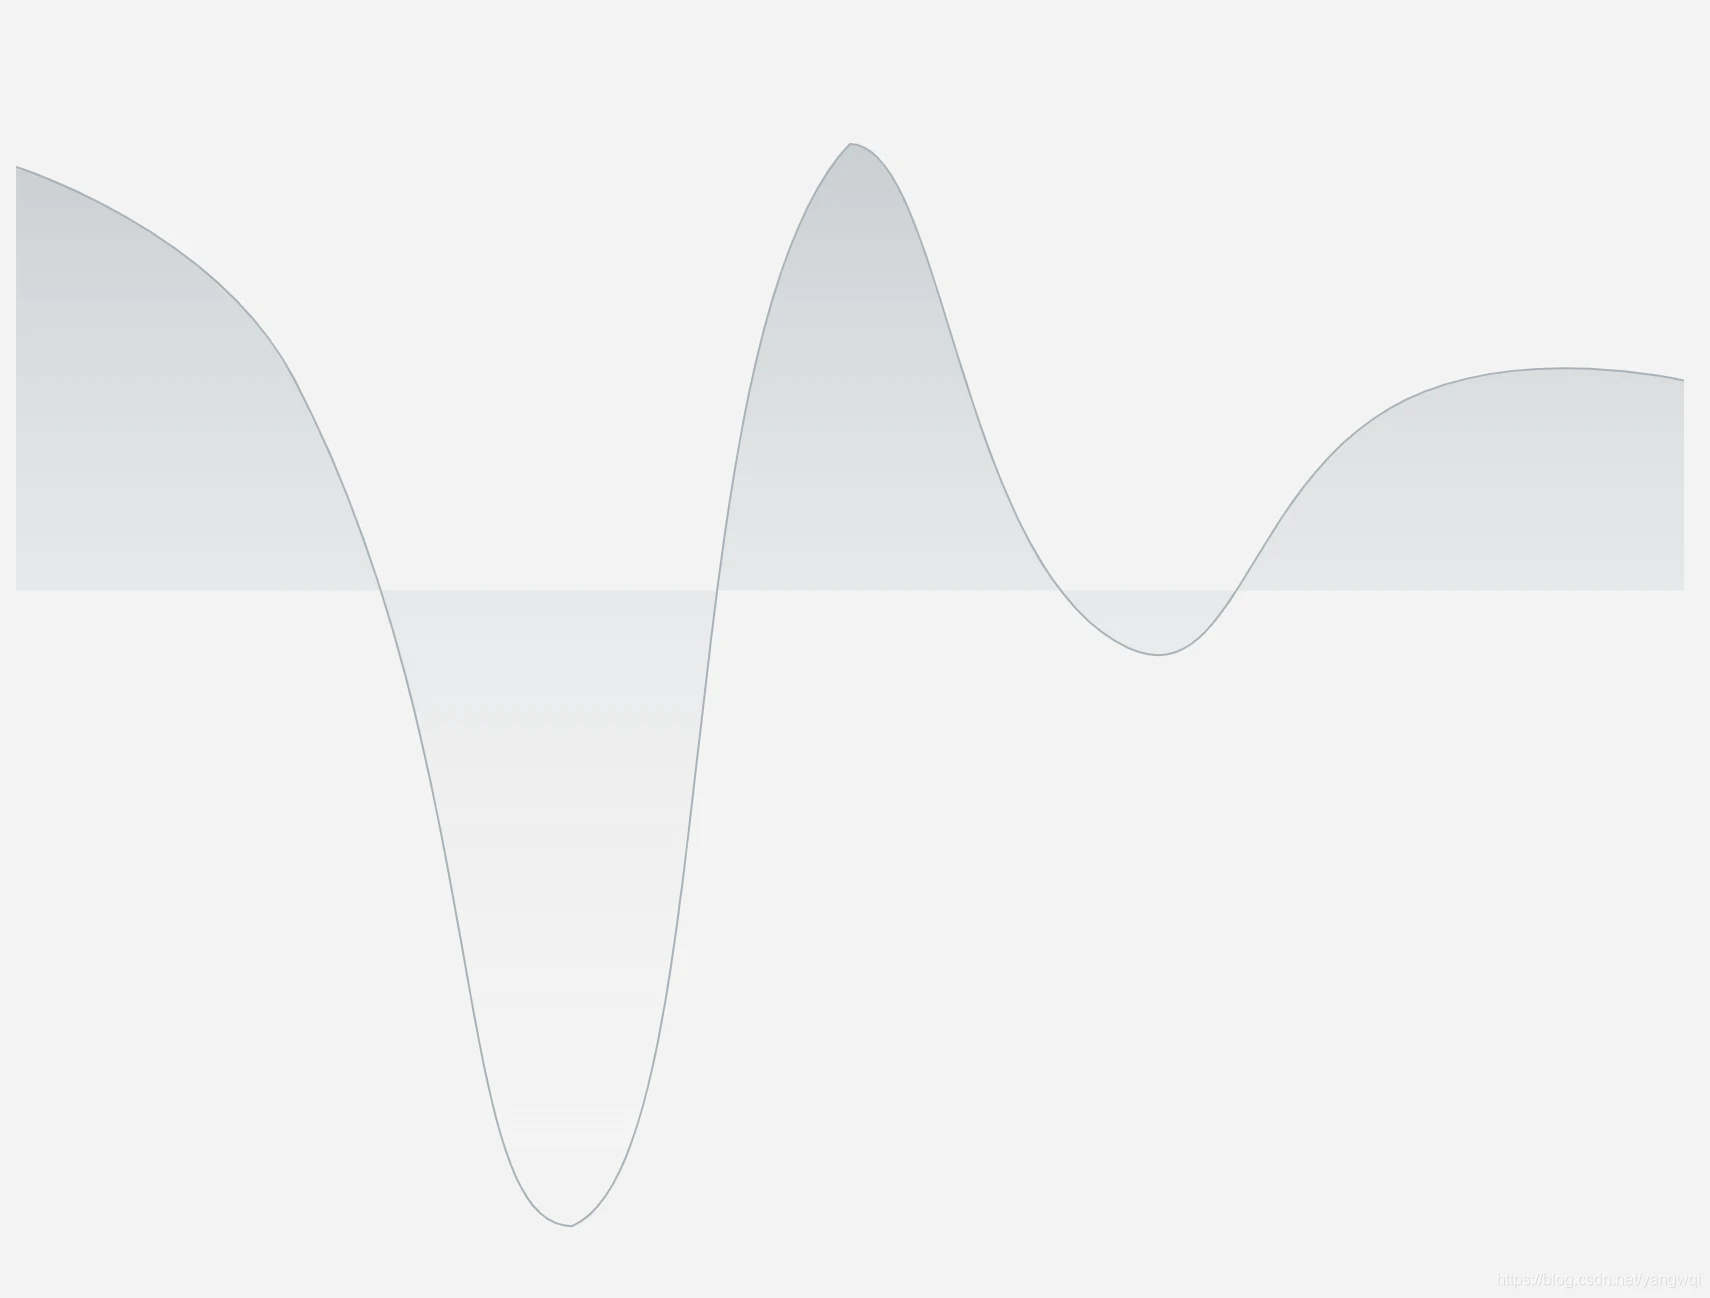
阴影区域 不以x轴为边界 仅在曲线下展示 :通过origin: "start"属性实现
option ={ grid: { left:0, right:10, top:0, bottom:0 }, xAxis: { type: 'category', boundaryGap: false, data: ['Mon', 'Tue', 'Wed', 'Thu', 'Fri', 'Sat', 'Sun'], axisLine: { show: false, }, axisLabel: { show: false, }, axisTick: { show: false }, }, yAxis: { type: 'value', // scale: false, // axisLabel: { // show: false, // }, splitLine: { show: false, }, axisLine: { show: false, onZero: false }, // axisTick: { show: false }, // alwaysShowContent: false }, series: [{ name: "bbb的值", type: 'line', smooth: true, //是否平滑显示 symbol: 'circle',//每个小点点的样式风格 // showSymbol: false,//默认不展示小点点 经过再显示 showAllSymbol: false, hoverAnimation:false, z: 10, symbolSize: 5, data: [222, 111, -333, 234, -30, 100, 110], // silent: false, itemStyle: { normal: { color: '#A9B2B8',//轨迹线和小点点的颜色 borderColor: '#A9B2B8',//小点点的边框颜色 } }, lineStyle: { normal: { width: 1, //连线粗细 color: "#A9B2B8", //轨迹线颜色 } }, // 阴影区域 areaStyle: { // 渐变颜色 color: new echarts.graphic.LinearGradient(0, 0, 0, 1, [{ offset: 0, color: 'rgba(169,178,184, 0.8)' }, { offset: 1, color: 'rgba(255, 255, 255, 0)' }]), origin: "start" // 常规设置 // normal: { // opacity: 0.3,//阴影面积 0无 1全 // color: "#ddd", // origin: "start" // }, } }] }
效果对比

静态绘制echarts:animation: false,
Echarts中属性areaStyle折线图线下方区域颜色修改
echarts折线图 鼠标移入不改变小点显示样式:hoverAnimation:false,==》echarts饼图鼠标移入,悬停部分不放大突出
Echart总结【一 坐标轴属性】
Echarts 的grid各个参数的含义
echarts属性的设置(完整大全)
echarts y轴均分问题
echarts属性随手记
echarts的series配置
饼图
Echarts 饼图中间添加文字、title、graphic
根据条件:取消ios端 左滑返回上一页的默认事件:@touchstart.prevent
<template> <div :id="id" class="chart" :ref="id" @touchend="remove" @touchstart="start"></div> </template> <script> import echarts from 'echarts' export default { props: { // 取消走势图默认事件 stopPrev: { type: Boolean, default: false, }, }, //... methods: { start(e) { if (this.stopPrev) { e.preventDefault() } }, }, } </script>隐藏tip和轴线
<template> <div :id="id" class="chart" :ref="id" @touchend="remove" @touchstart.prevent></div> </template> methods: { // 隐藏tip remove(){ // 鼠标移出 隐藏tip this.chart.dispatchAction({ type: 'hideTip' }) // 鼠标移出 隐藏轴线 this.chart.dispatchAction({ type: 'updateAxisPointer', currTrigger: 'leave' }) } },dispatchAction hideTip 时只隐藏了tooltip的content,没有隐藏axisPointer
到此这篇Echarts相关属性的文章就介绍到这了,更多相关内容请继续浏览下面的相关推荐文章,希望大家都能在编程的领域有一番成就!版权声明:
本文来自互联网用户投稿,该文观点仅代表作者本人,不代表本站立场。本站仅提供信息存储空间服务,不拥有所有权,不承担相关法律责任。
如若内容造成侵权、违法违规、事实不符,请将相关资料发送至xkadmin@xkablog.com进行投诉反馈,一经查实,立即处理!
转载请注明出处,原文链接:https://www.xkablog.com/rfx/11168.html
